Buckle up — it’s going to be an insightful (and slightly nerdy) ride! 🚀 In this special blog collaboration with Martin Holt from Callista, a developer and architect with a deep interest in Java and Kafka, we’re diving deep into the world of OpenTelemetry.
After you have understood the OTEL Collector (you only need to read this blog… just kidding), Martin’s post is a great next step on your journey to understand how to do observability with OpenTelemetry.
Understanding the OpenTelemetry Collector: Your “Single Point of Entry” for Telemetry Data
In today’s complex and dynamic software environments, monitoring and observability are crucial for maintaining system health and performance. One powerful protocol that has emerged in this space is OpenTelemetry that ships a powerful tool, the OpenTelemetry Collector. This executable simplifies the process of setting up a single point of entry for your telemetry data, enabling you to work with the data before it is exported to one, multiple, or no system at all – or as I would call it, the integration platform for your telemetry data with super powers.
What is the OpenTelemetry Collector?
The OpenTelemetry Collector is a versatile and robust component of the OpenTelemetry project. It acts as an intermediary that collects, processes, and exports telemetry data (if needed) such as traces, metrics, logs and profiles. By providing a unified way to handle telemetry data, the OpenTelemetry Collector helps streamline observability and monitoring efforts across diverse environments.
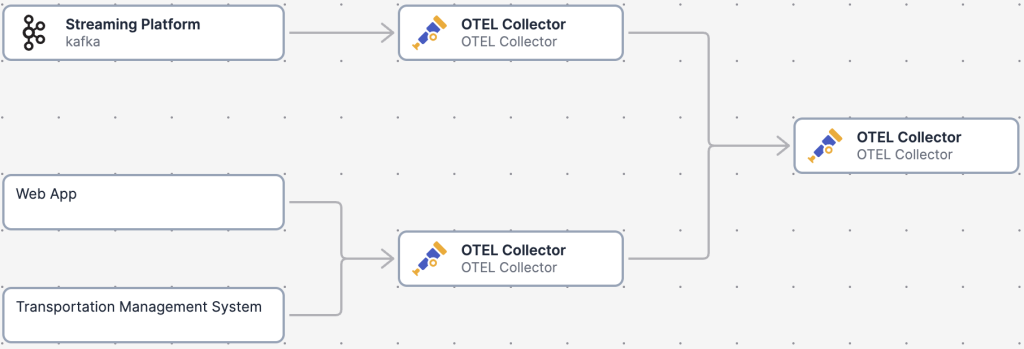
The collector can be put into a daisy chain, enabling us to create a hierarchy of collectors spread around complex environments. This hierarchical setup allows for more efficient data processing and routing, especially in large-scale environments with multiple layers of infrastructure and applications/services.
It really is one of the most robust, scalable and flexible solutions I have seen, it can run on linux, windows in docker, etc. Also services like Azure Container Apps have built in collectors.
And best of all, it is configurable using a simple YAML file (not that YAML is that great), which is easy to read, easy to validate (thanks to the collector, validation is built in and can be validated before running using the collector as well).
receivers:
  otlp:
    protocols:
      grpc:
        endpoint: 0.0.0.0:4317
      http:
        endpoint: 0.0.0.0:4318

processors:
  batch:

exporters:
  otlp:
    endpoint: otelcol:4317

service:
  pipelines:
    traces:
      receivers: [otlp]
      processors: [batch]
      exporters: [otlp]
    metrics:
      receivers: [otlp]
      processors: []
      exporters: [otlp]
The above is an example of a configuration saying:
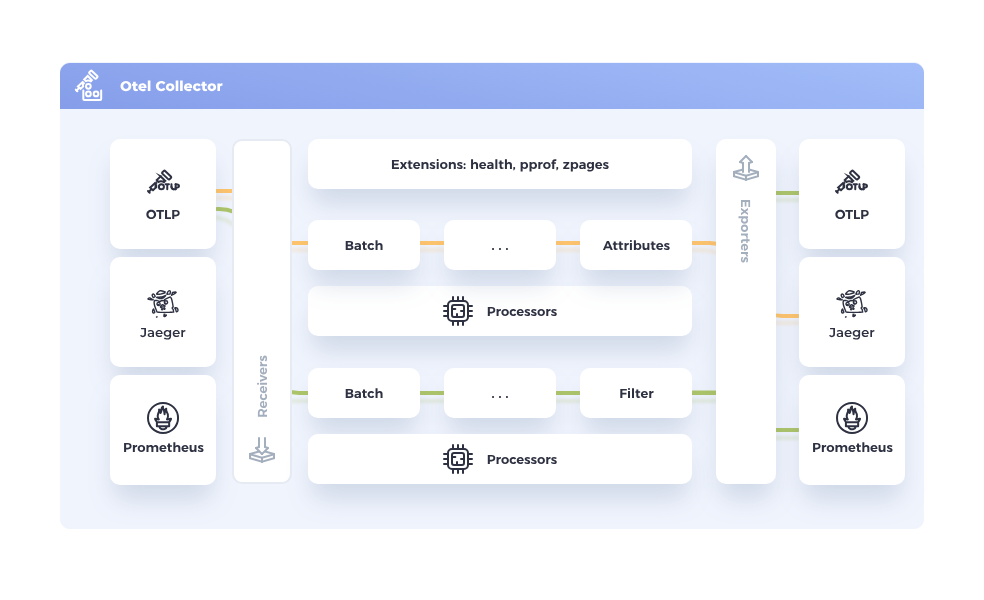
- Receivers: The collector is able to receive data using 2 different endpoints, one for http and one for grpc. This is the endpoint applications or other OTEL Collectors can use to distribute telemetry data to.
- Processors: After receiving telemetry data, the otel collector is configured to provide a possibility to batch the data using the batch processor before it is going further in the pipelines that use the batch processor.
- Exporters: Data can be distributed to an OTLP endpoint. This is useful when sending data to monitoring solutions providing an OTLP endpoint or even another OpenTelemetryCollector
- And now to the important part, the actual pipelines, those define what you are actually doing or what the OTEL Collector is doing. It says the following:
- Traces are being received by using the OTLP receiver in the configuration, it is batched and then exported to the OTLP exporter.
- Metrics are being received by using the OTLP receiver in the configuration, not batched and then exported to the OTLP exporter.
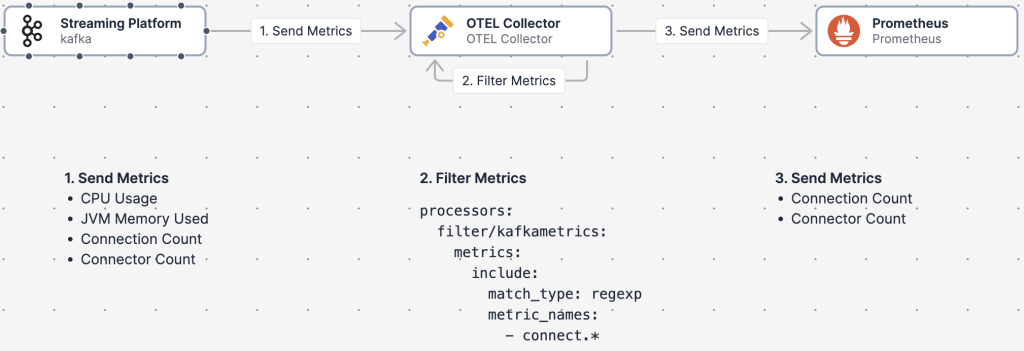
Please check Martin’s post to see an example on how to use the otel collector to scrape “legacy” prometheus endpoints. [TODO: link to martins post]
Key Features of the OpenTelemetry Collector
1. Single Point of Entry
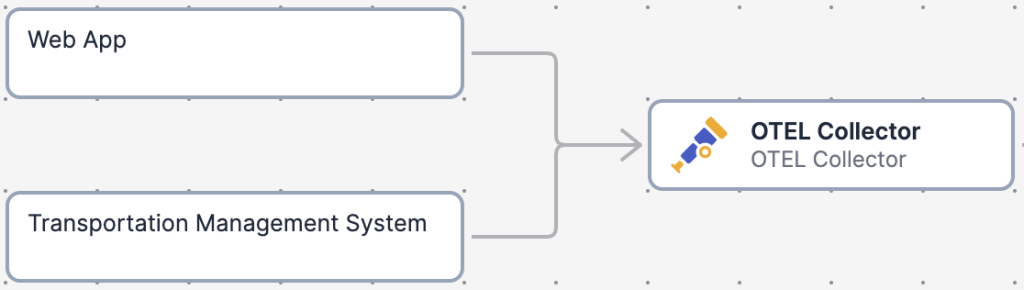
The OpenTelemetry Collector serves as a centralized point for all your telemetry data. This means you can configure your applications to send their telemetry data to the Collector, which then processes and routes the data to the appropriate backend systems. This centralization simplifies the configuration and management of telemetry data pipelines.
2. Data Processing Capabilities
Before exporting telemetry data to various backend systems, the OpenTelemetry Collector allows you to perform a range of processing tasks. These tasks can include filtering, aggregation, transformation, and enrichment of data. This flexibility ensures that the data you export is tailored to meet your specific monitoring and observability needs.
processors:
  filter/excludemetrics:
    metrics:
      exclude:
      match_type: strict
      metric_names:
        - your_metric
The above example would exclude “your_metric” metrics before being shipped to your backend system.
To get a full list of available processors, you can visit the OpenTelemetry Contrib project’s github page: opentelemetry-collector-contrib/processor at main · open-telemetry/opentelemetry-collector-contrib · GitHub
3. Multiple Export Destinations
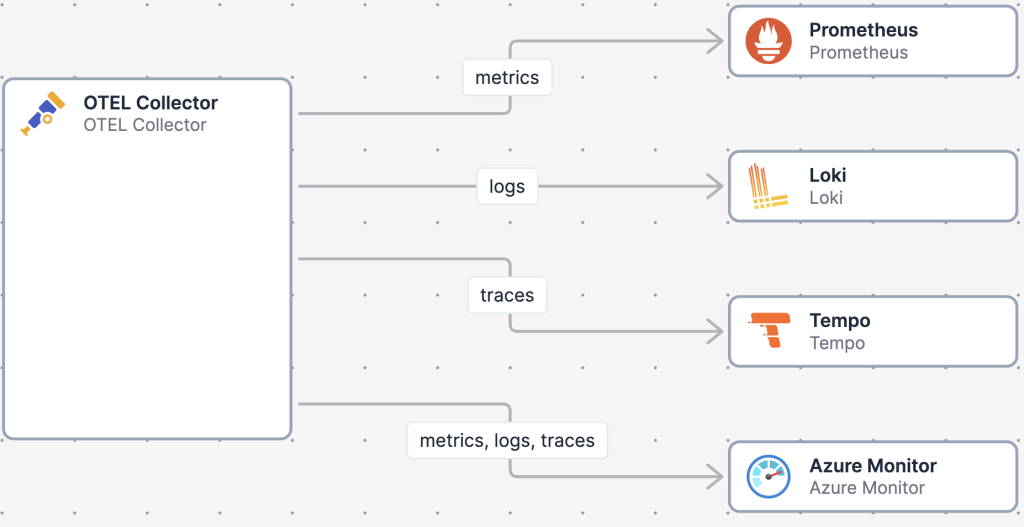
The OpenTelemetry Collector supports exporting telemetry data to multiple backend systems simultaneously. Whether you are using Prometheus, Jaeger, Zipkin, or any other observability tool, the Collector can route your data accordingly. This multi-destination capability ensures that you can leverage the strengths of different tools without being locked into a single solution.
The Collector enables us to set multiple pipelines depending on how you are structuring your telemetry data. If everything (all logs, all metrics, all traces, all profiles) is supposed to go into one database, you can simply do that by using the following configuration:
service:
  pipelines:
    logs:
      exporters: [otlp/yourdatabase]
      receivers: [otlp]
As mentioned before in the example config. This example simply says: All telemetry data is received on the OTLP receiver and shipped to the otlp/yourdatabase exporter.
Alternatively, if you need to route logs based on receivers (there are many more ways to filter your data and use pipelines to export data based on attributes), you can set up a dedicated log pipeline for that purpose. This allows for more granular control over your telemetry data routing:
service:
  pipelines:
    logs:
      exporters: [otlp/yourdatabase]
      receivers: [otlp]
    logs/files:
      exporters: [otlp/loki]
      receivers: [filelog/iis]
The above example would simply still export all logs that are retrieved on the OTLP endpoint to the OTLP/yourdatabase receiver, but there is one configuration in which logs are read from a file based system that will be exported to Loki, a database specifically designed for logs.
By structuring your telemetry data and applying filters and pipelines, the OpenTelemetry Collector provides the flexibility to distribute data to various systems according to your specific requirements.
4. Extensibility and Customization
The OpenTelemetry Collector is designed with extensibility in mind. You can customize its behavior through configuration and extend its functionality with custom processors, exporters, and receivers. This modularity allows you to adapt the Collector to fit your unique requirements and integrate it seamlessly into your observability stack.
5. Configuration Validation
For me, the last feature to mention is the ability to validate configuration files, which I already mentioned before. This ensures that your configurations are correct and will function as expected before you deploy them. By validating configurations, the Collector helps prevent errors and misconfigurations that could disrupt your telemetry data pipeline. This feature is particularly useful in complex environments where precision and reliability are paramount.
Personally, I prefer to setup a validation stage in my CI/CD pipelines in which I validate, before even trying to push the new configurations out to runtime (yes, I know, I could let the containers validate itself and revert in case it failed, but that is not the way I work… Also I get immediate response in the pipelines, no alerts from the environment).
Conclusion
The OpenTelemetry Collector is a powerful tool that simplifies the management of telemetry data in modern software environments. By providing a single point of entry, robust data processing capabilities, and support for multiple export destinations, the Collector enables you to gain deeper insights into your system’s performance and health. Whether you are just starting with observability or looking to enhance your existing setup, the OpenTelemetry Collector is a valuable addition to your toolkit.
Hope you found this interesting. If so please see Martin’s continuation with Quarkus and Kafka.